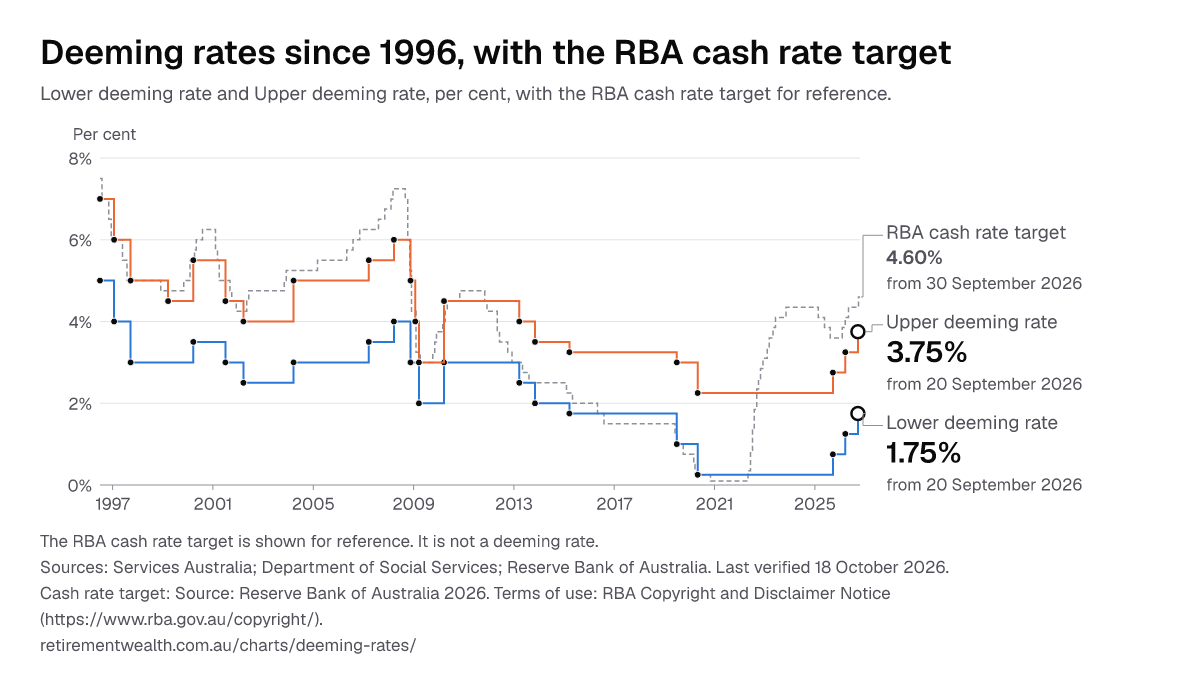
Deeming rates since 1996, with the RBA cash rate target
Deeming assumes that financial investments earn a set rate of income, whatever they actually earn. Income above the deemed rate is not assessed, and the deeming rates are applied to the total market value of a person's financial investments. (Social Security Guide, 4.4.1.10 Overview of deeming, Department of Social Services, reviewed 21 September 2026.) The RBA cash rate target is shown for reference. It is not a deeming rate.
- Latest change 20 September 2026
- Last verified 18 October 2026
Deeming rates1.75% lower and 3.75% upper, from 20 September 2026
RBA cash rate target4.60% from 30 September 2026, decided on 29 September 2026
The values
| Applies from | Lower deeming rate | Upper deeming rate | RBA cash rate target in force | Sources |
|---|---|---|---|---|
| 20 September 2026 | 1.75% | 3.75% | 4.35%from 6 May 2026 | 13 |
| 20 March 2026 | 1.25% | 3.25% | 4.10%from 18 March 2026 | 23 |
| 20 September 2025 | 0.75% | 2.75% | 3.60%from 13 August 2025 | 23 |
| 1 May 2020 | 0.25% | 2.25% | 0.25%from 20 March 2020 | 23 |
| 1 July 2019 | 1% | 3% | 1.25%from 5 June 2019 | 23 |
| 20 March 2015 | 1.75% | 3.25% | 2.25%from 4 February 2015 | 23 |
| 4 November 2013 | 2% | 3.5% | 2.50%from 7 August 2013 | 23 |
| 20 March 2013 | 2.5% | 4% | 3.00%from 5 December 2012 | 23 |
| 20 March 2010 | 3% | 4.5% | 4.00%from 3 March 2010 | 23 |
| 20 March 2009 | 2% | 3% | 3.25%from 4 February 2009 | 23 |
| 26 January 2009 | 3% | 4% | 4.25%from 3 December 2008 | 23 |
| 17 November 2008 | 3% | 5% | 5.25%from 5 November 2008 | 23 |
| 20 March 2008 | 4% | 6% | 7.25%from 5 March 2008 | 23 |
| 20 March 2007 | 3.5% | 5.5% | 6.25%from 8 November 2006 | 23 |
| 20 March 2004 | 3% | 5% | 5.25%from 3 December 2003 | 23 |
| 20 March 2002 | 2.5% | 4% | 4.25%from 5 December 2001 | 23 |
| 1 July 2001 | 3% | 4.5% | 5.00%from 4 April 2001 | 23 |
| 20 March 2000 | 3.5% | 5.5% | 5.50%from 2 February 2000 | 23 |
| 20 March 1999 | 3% | 4.5% | 4.75%from 2 December 1998 | 23 |
| 20 September 1997 | 3% | 5% | 5.00%from 30 July 1997 | 23 |
| 23 January 1997 | 4% | 6% | 6.00%from 11 December 1996 | 23 |
| 1 July 1996 | 5% | 7% | 7.50%from 14 December 1994 | 23 |
Reading this chart
- A rate applies from its start date until the next one starts. Nothing between two dates is estimated or smoothed.
- Each date on which the lower deeming rate or the upper deeming rate changed is marked on its line. Rates are per cent, as published.
- Lower deeming rate: Determined by the Minister by legislative instrument under subsection 1082(1) of the Social Security Act 1991, which calls it the below threshold rate. There is no fixed review date. Source: Social Security Act 1991, section 1082 (compilation No. 234, 20 September 2026).
- Upper deeming rate: Determined by the Minister by legislative instrument under subsection 1082(2) of the Social Security Act 1991, which calls it the above threshold rate. There is no fixed review date. Source: Social Security Act 1991, section 1082 (compilation No. 234, 20 September 2026).
- The cash rate target is set by the Reserve Bank of Australia and is shown for reference only: it is not a deeming rate. The RBA cash rate target can be hidden with the toggle above the chart; the table and the data files keep it.
- The Reserve Bank of Australia's next decision: Monetary Policy Board meeting, 2-3 November 2026.
Sources
- Services Australia: Deeming (Age Pension)
- Department of Social Services: Social Security Guide, 4.4.1.10 Overview of deeming
- Reserve Bank of Australia: Cash Rate Target
Cash rate target: Source: Reserve Bank of Australia 2026. Terms of use: RBA Copyright and Disclaimer Notice.
RBA cash rate target: each change from the Reserve Bank of Australia's Cash Rate Target page, with the statement behind it; the latest is Statement by the Monetary Policy Board: Monetary Policy Decision (media release 2026-27), 29 September 2026.
Download the data
- The rates as CSV and as JSON. Notes for the files, also in the CSV's metadata file:
- Deeming rates since 1996, with the RBA cash rate target. Retirement Wealth, https://retirementwealth.com.au/charts/deeming-rates/
- Rates are per cent, as published. Lower deeming rate: Determined by the Minister by legislative instrument under subsection 1082(1) of the Social Security Act 1991, which calls it the below threshold rate. There is no fixed review date. Upper deeming rate: Determined by the Minister by legislative instrument under subsection 1082(2) of the Social Security Act 1991, which calls it the above threshold rate. There is no fixed review date. The cash rate target is set by the Reserve Bank of Australia and is shown for reference only: it is not a deeming rate.
- reference and reference_from: the RBA cash rate target in force on applies_from and the date it took effect, from the Reserve Bank of Australia's Cash Rate Target page (https://www.rba.gov.au/statistics/cash-rate/). The RBA cash rate target is shown for reference. It is not a deeming rate.
- Cash rate target: Source: Reserve Bank of Australia 2026. Terms of use: RBA Copyright and Disclaimer Notice (https://www.rba.gov.au/copyright/).
- Retirement Wealth provides selected factual information about Australian retirement rules and rates. It does not provide personal or general financial product advice or recommend financial products. Summaries may not cover every condition or exception. Check the linked official sources and obtain advice appropriate to your circumstances before making financial decisions.
- Deeming rate (lower) as JSON (figure page)
- Deeming rate (upper) as JSON (figure page)
- Cash Rate Target, as announced as JSON
Cite this chart
Deeming rates since 1996, with the RBA cash rate target. Official sources: Services Australia; Department of Social Services; Reserve Bank of Australia (last checked 18 October 2026). Retirement Wealth, https://retirementwealth.com.au/charts/deeming-rates/
Use this chart
This chart is free to place on another website. The code below has two parts: the chart, and a link to this page as its source.
The embedded chart sets no cookies, stores nothing in the browser, runs no analytics and loads nothing from other sites.
Keep the link to this page with the chart.